Reports and Stats

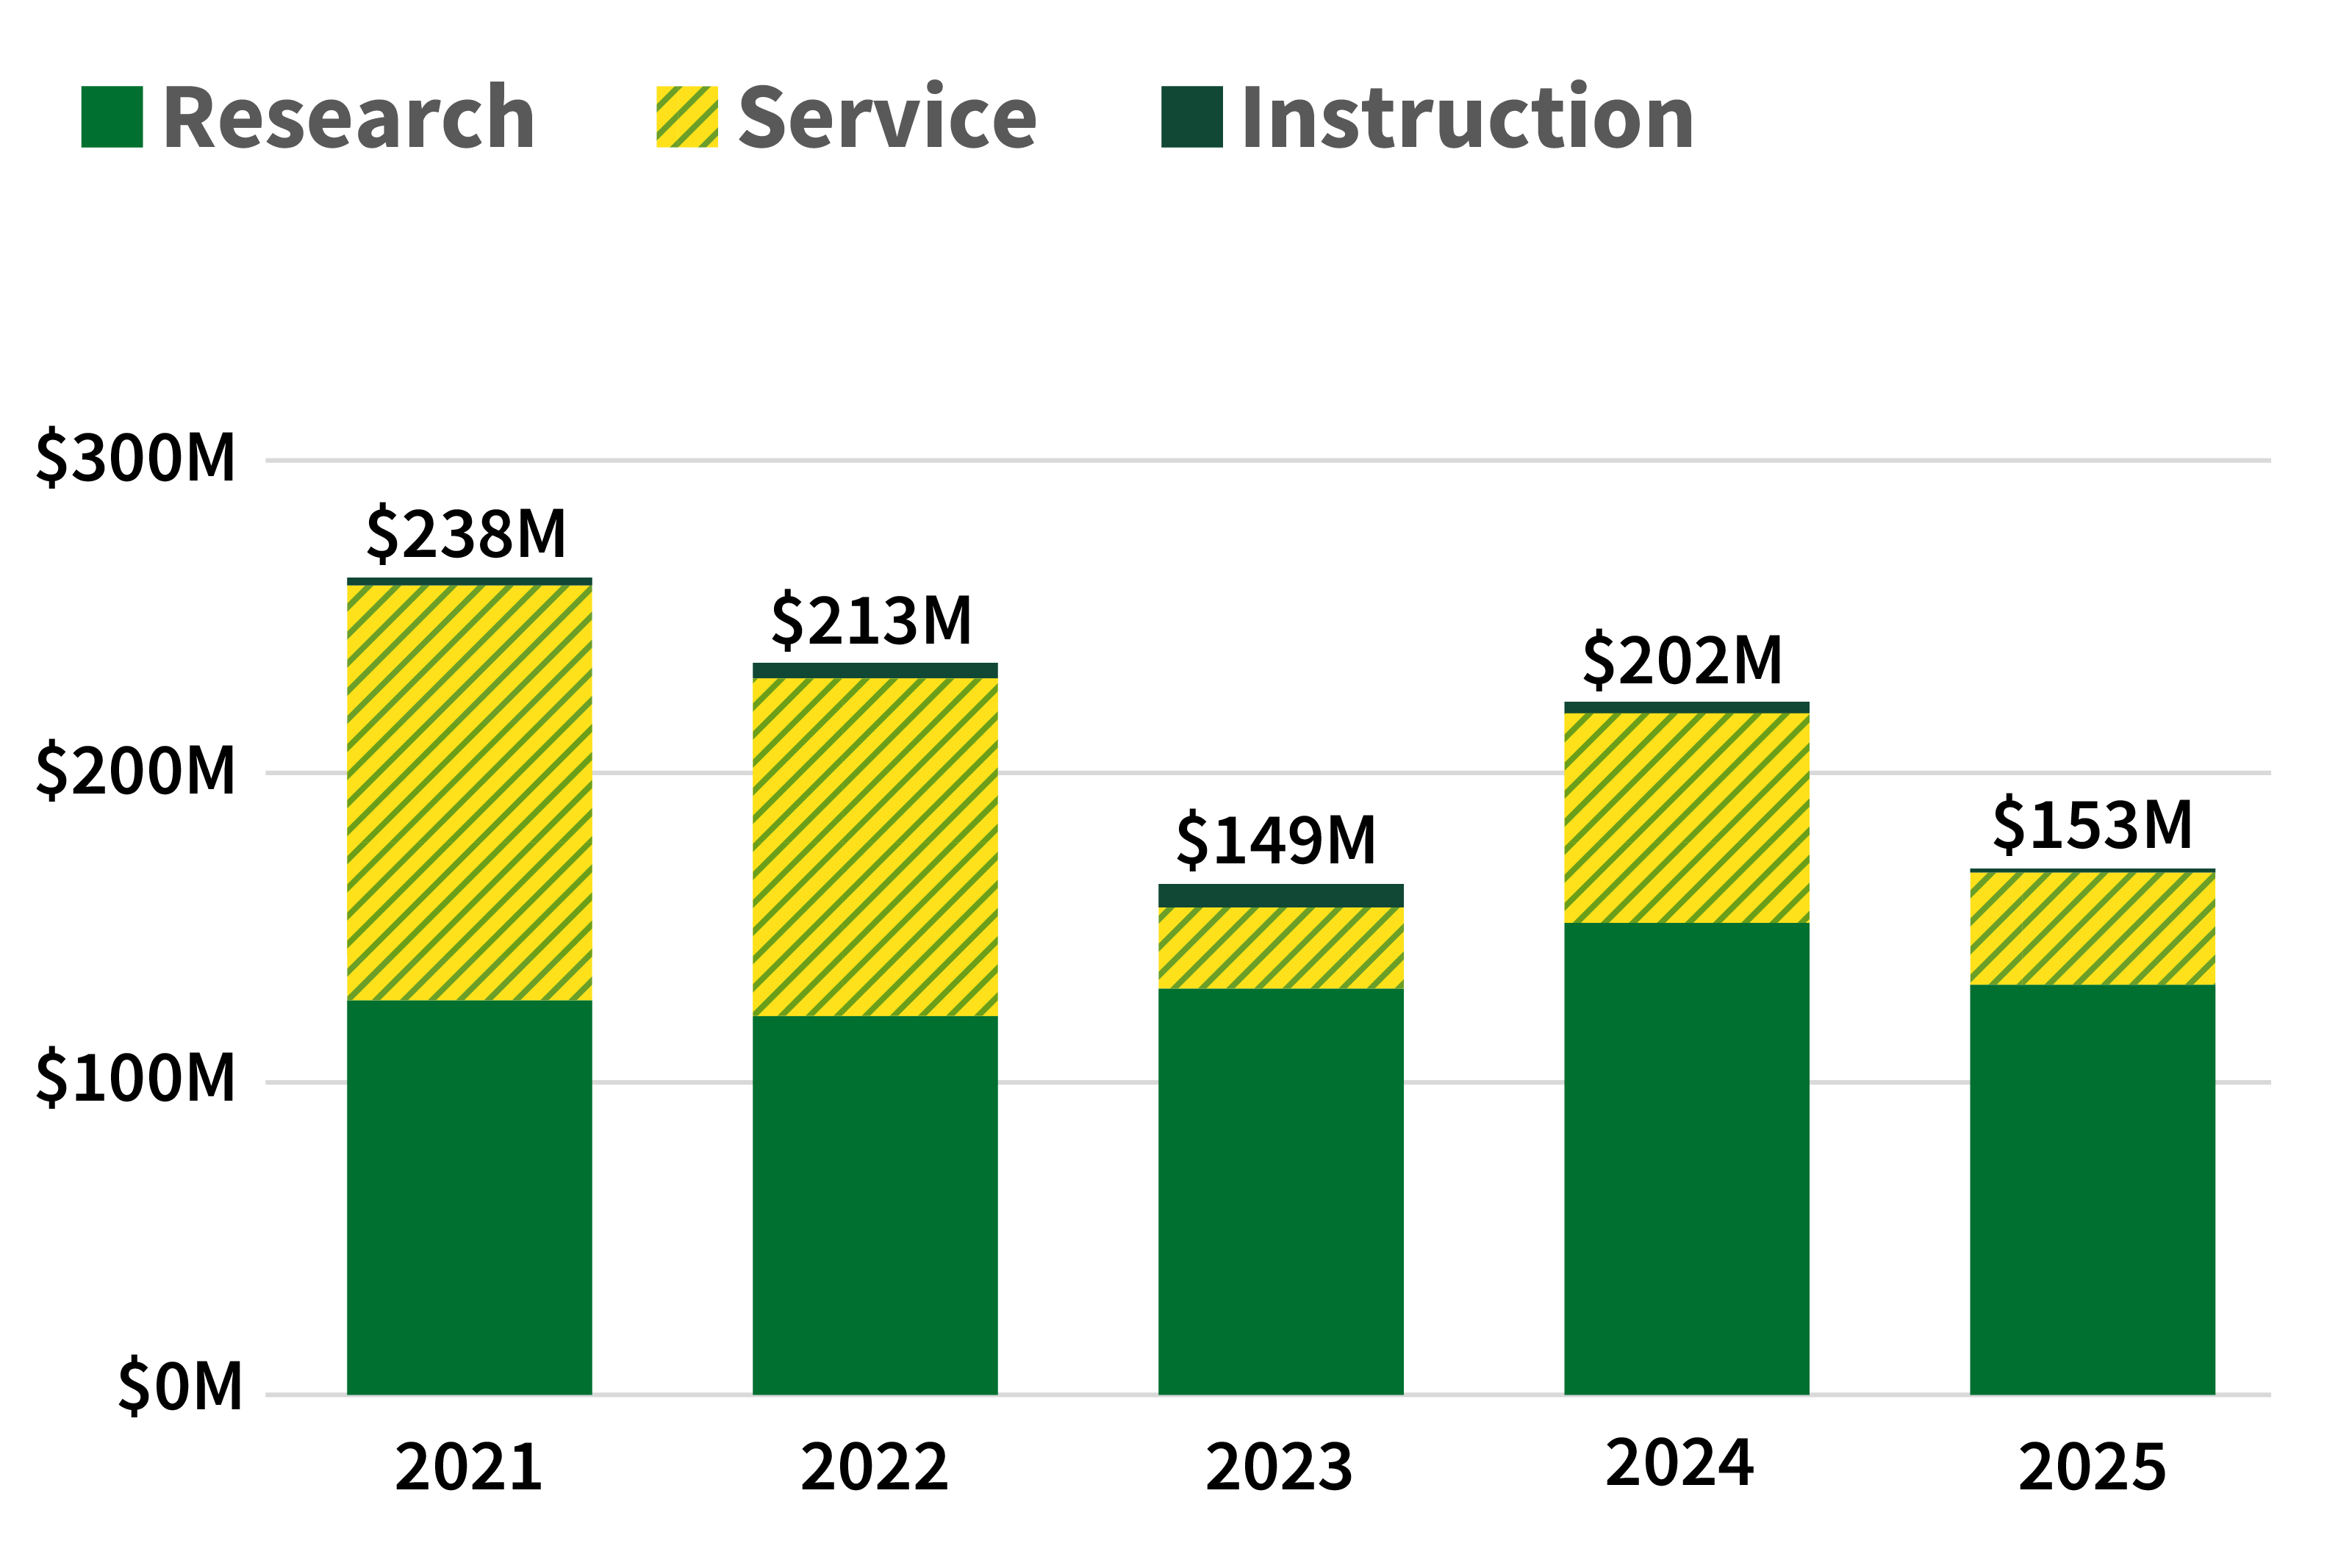
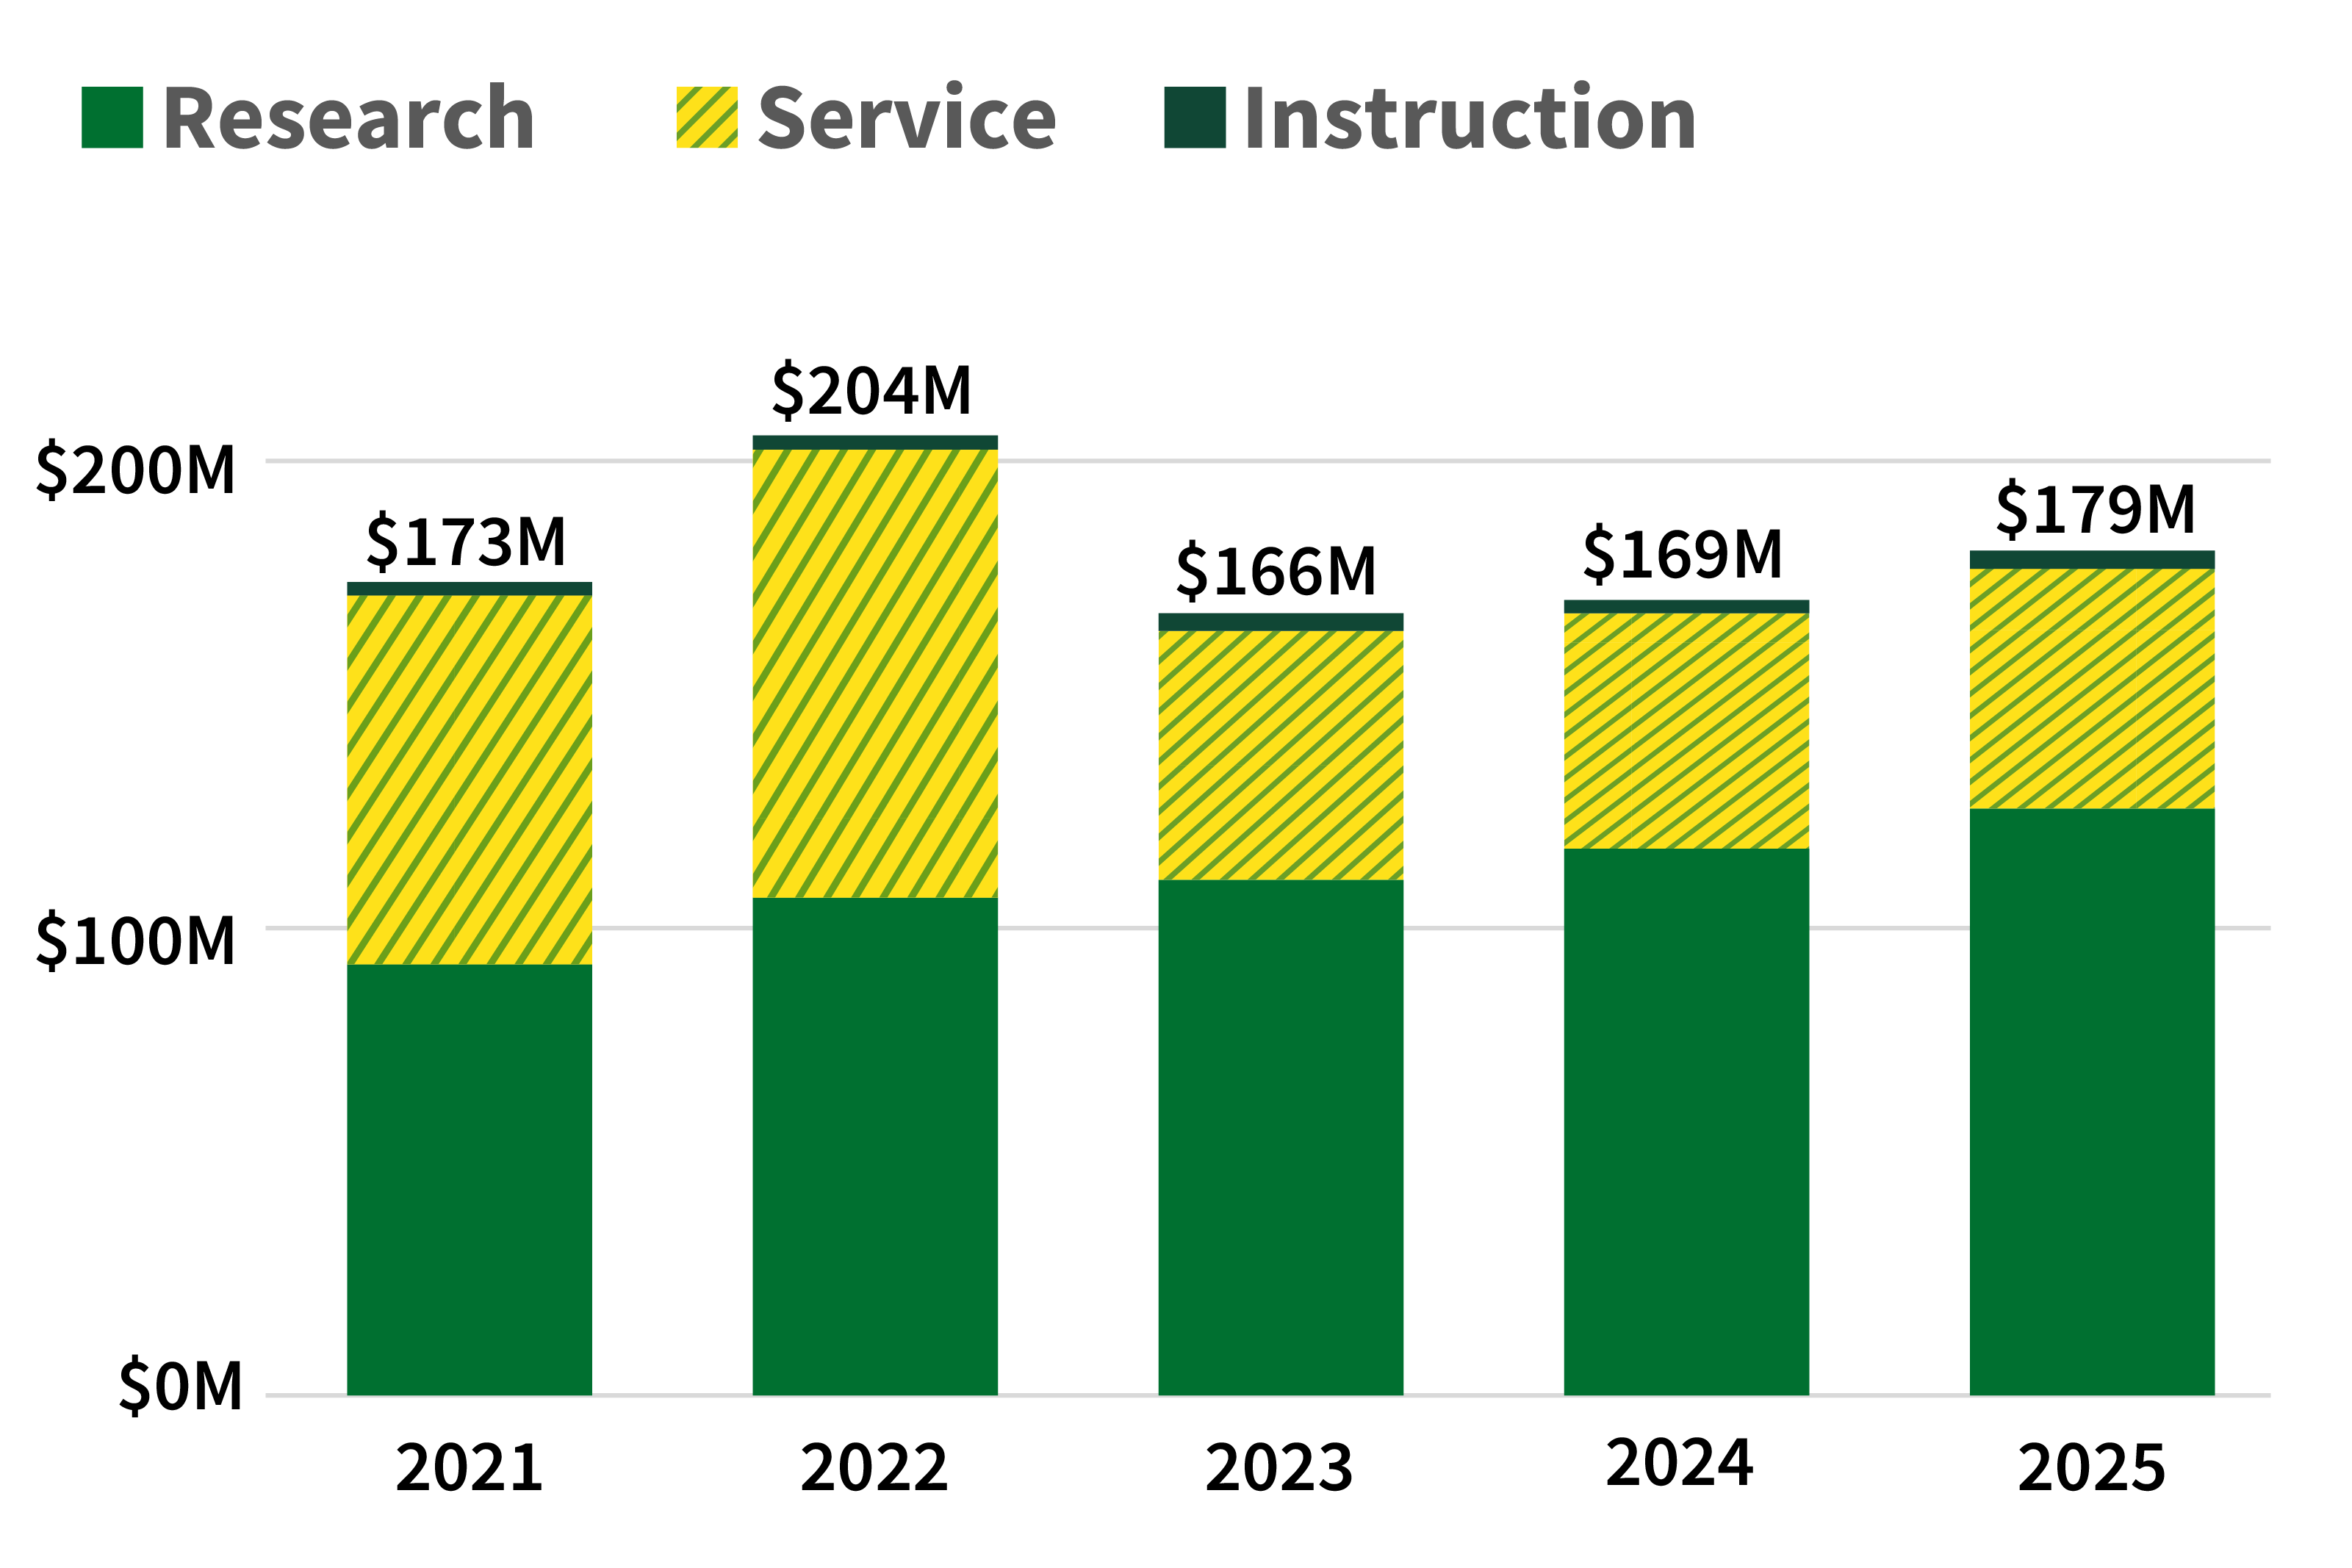
The University of Oregon’s research expenditures increased by $9 million in fiscal year 2024-25 (FY25) to $125 million. However, sponsored project funding, which supports scholarship and creative activity across the university, decreased to $153 million in new awards from $202 million in FY24—a reflection of the dramatic shift in federal priorities related to research, as well as delays in proposal reviews and award cancellations.

We offer an interactive dashboard with insights into externally sponsored projects—proposals, awards, and expenditures—to users with a Duck ID. Please reach out to researchanalytics@uoregon.edu for more information. 


Sponsored Activity Dashboard

5-Year New Award Trend
 
Bar chart of 5-year new award trend. In 2021, research: $115M, service: $121M, instruction: $2M, total: $238M. In 2022, research: $111M, service: $98M, instruction: $5M, total: $213M. In 2023, research: $119M, service: $24M, instruction: $6M, total: $149M. In 2024, research: $138M, service: $61M, instruction: $3M, total: $202M. In 2025, research: $119M, service: $33M, instruction: $569K, total: $153M.
Sponsored activities cover research and creative activity, as well as instruction (e.g., new course or curriculum development) and service (e.g., programming and services provided by the university). FY25 sponsored project funding decreased to $153 million in new awards from $202 million in FY24.
Awards by Sponsor
 
Tree map of awards by sponsor. 42% from National Institutes of Health. 17% is other Federal. 15% is non-Federal. 13% from National Science Foundation. 12% from US Department of Education.
The major funders of UO sponsored activities are the National Institutes of Health (42%), the National Science Foundation (13%), and the US Department of Education (12%). Other federal sources of sponsorship increased in FY25. Non-federal sponsors include private foundations, non-profits, state contracts, and more. 


Expenditures by Faculty Rank
 
Pie chart of expenditures by faculty rank. Professor: $73M, 41%. Associate Professor: $56M, 31%. Assistant Professor: $17M, 9%. Other: $33M, 18%.
Sponsored activities cover research, as well as instruction (e.g., new course or curriculum development) and service (e.g., programming and services provided by the university). The UO’s unique research portfolio includes not only tenure-track faculty, but demonstrates immense strength among career research faculty, represented in the “Other” category, along with graduate students and postdoctoral scholars securing fellowships.
5-Year Sponsored Expenditures
 
Bar chart of 5-year sponsored expenditures. In 2021, research: $91M, service: $79M, instruction: $3M, total: $173M. In 2022, research: $105M, service: $95M, instruction: $3M, total: $204M. In 2023, research: $109M, service: $53M, instruction: $4M, total: $166M. In 2024, research: $116M, service: $50M, instruction: $3M, total: $169M. In 2025, research: $125M, service: $51M, instruction: $3M, total: $179M.
Research expenditures are a critical metric for R1 universities, reflecting an institution’s ability to secure funding, drive innovation, support faculty and student research, and contribute to economic and societal advancement. Since 2020, research expenditures have grown by 35%.

Celebrating our 2025 achievements.

UO drives discoveries that benefit local, regional, and global communities.


365
grants awarded


85%
federally funded


$153M
sponsored expenditures

Investors and industry partners help bring UO innovations to the world.


7,646
total licenses


27
active startups


$8M
licensing revenue


Reports

Monthly Awards Reports

The Office of the Vice President for Research & Innovation (OVPRI) provides a monthly summary of funding awards and projects at the University of Oregon. Please note that the monthly award reports do not include recurring task orders on existing grants., non-competitive continuations, and other types of supplemental funding.

Sponsored Project Services Annual Reporting

Sponsored Project Services (SPS), a service unit within the Office of the Vice President for Research & Innovation (OVPRI), prepares an annual summary of sponsored activity at the University of Oregon.

Financial Reporting

The Business Affairs office at the University of Oregon provides a variety of financial statements and reports, including annual and quarterly financial reports for the University. Visit their financial reports page for more information.