Reports and Stats

The University of Oregon’s research enterprise continued to grow in fiscal year 2023-24 (FY24) across all disciplines to support transformative research, scholarship, and creative activity. Sponsored project funding again increased, a key predictor of research growth with $178 million in new awards, a 47% increase from FY23.

5-Year New Award Trend
 
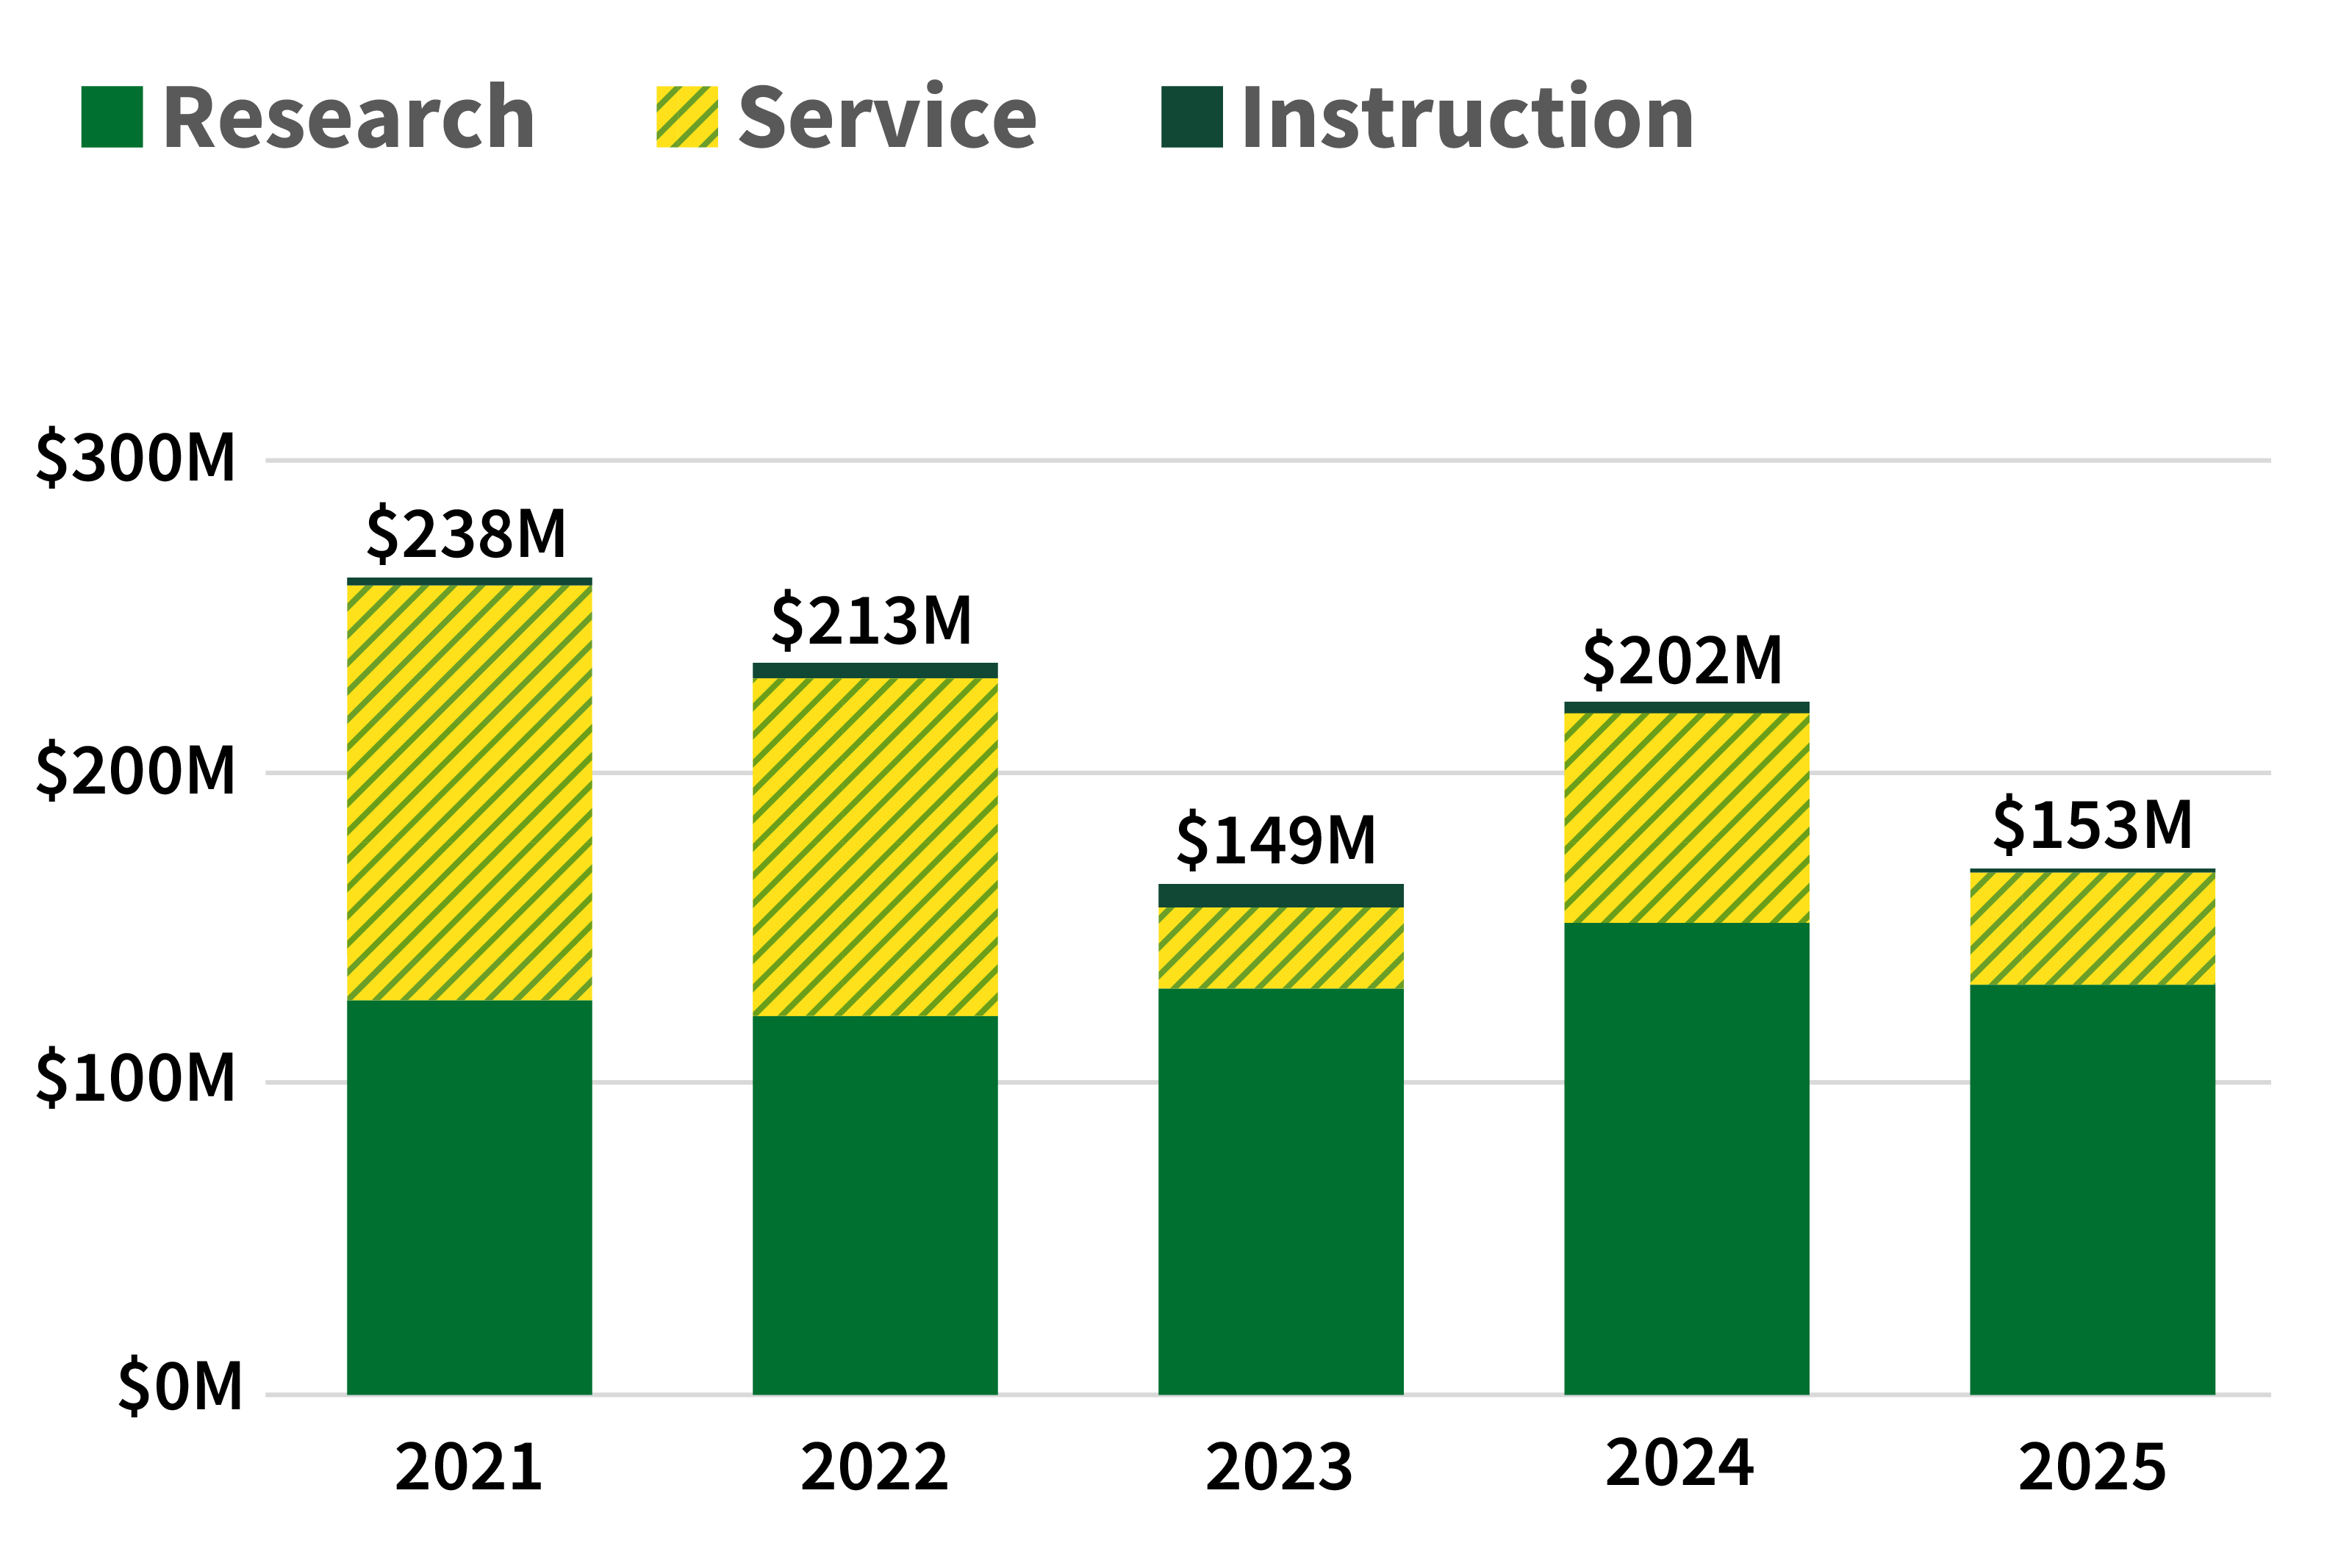
Bar chart of 5-year new award trend. In 2020, research: $71M, service: $38M, instruction: $606K, total: $109M. In 2021, research: $82M, service: $47M, instruction: $2M, total: $130M. In 2022, research: $88M, service: $75M, instruction: $5M, total: $167M. In 2023, research: $98M, service: $19M, instruction: $5M, total: $122M. In 2024, research: $121M, service: $60M, instruction: $3M, total: $184M.
Sponsored activities cover research, as well as instruction (e.g., new course or curriculum development) and service (e.g., programming and services provided by the university). In the past five years, the UO has significantly increased its new research awards, from $124M in FY20 to $178M in FY24. 
Awards by Sponsor
 
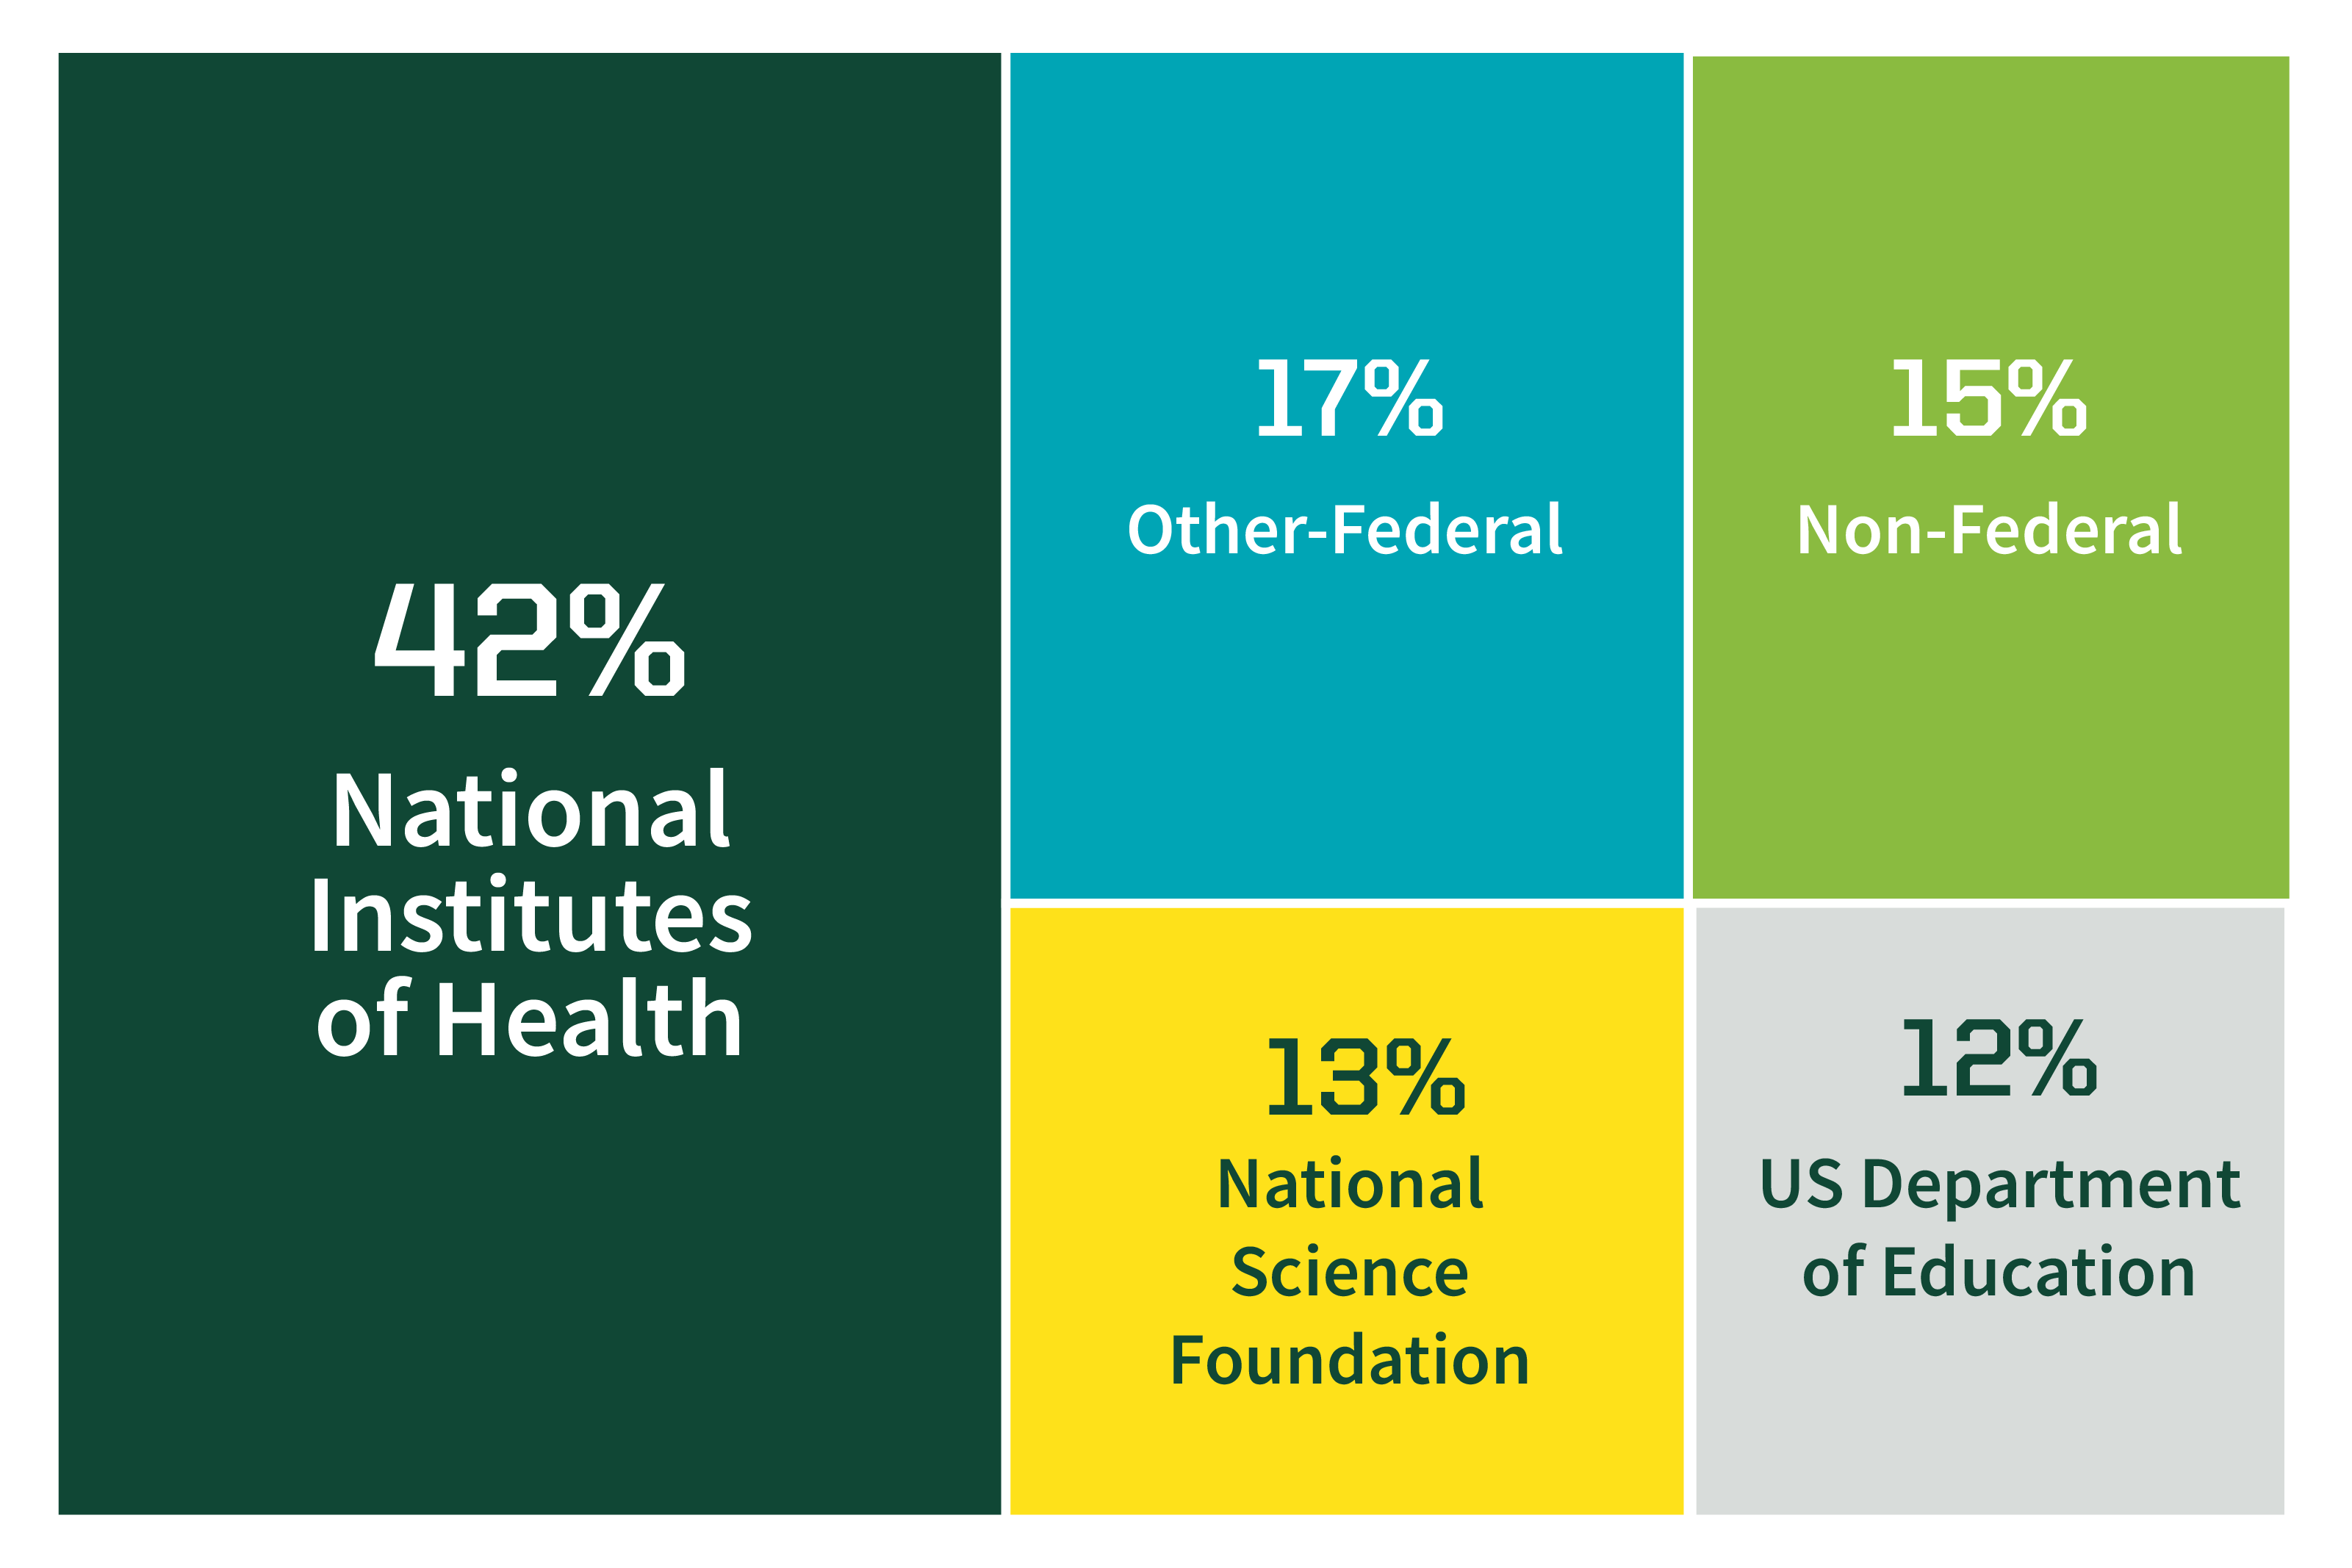
Tree map of awards by sponsor. 32% from US Department of Education. 20% from National Science Foundation. 20% from National Institutes of Health. 20% is non-Federal. 8% is other Federal.
The major funders of UO sponsored activities are the US Department of Education (32%), the National Science Foundation (20%), and the National Institutes of Health (20%). Non-federal sponsors include private foundations, non-profits, state contracts, and more. 


Expenditures by Faculty Rank
 
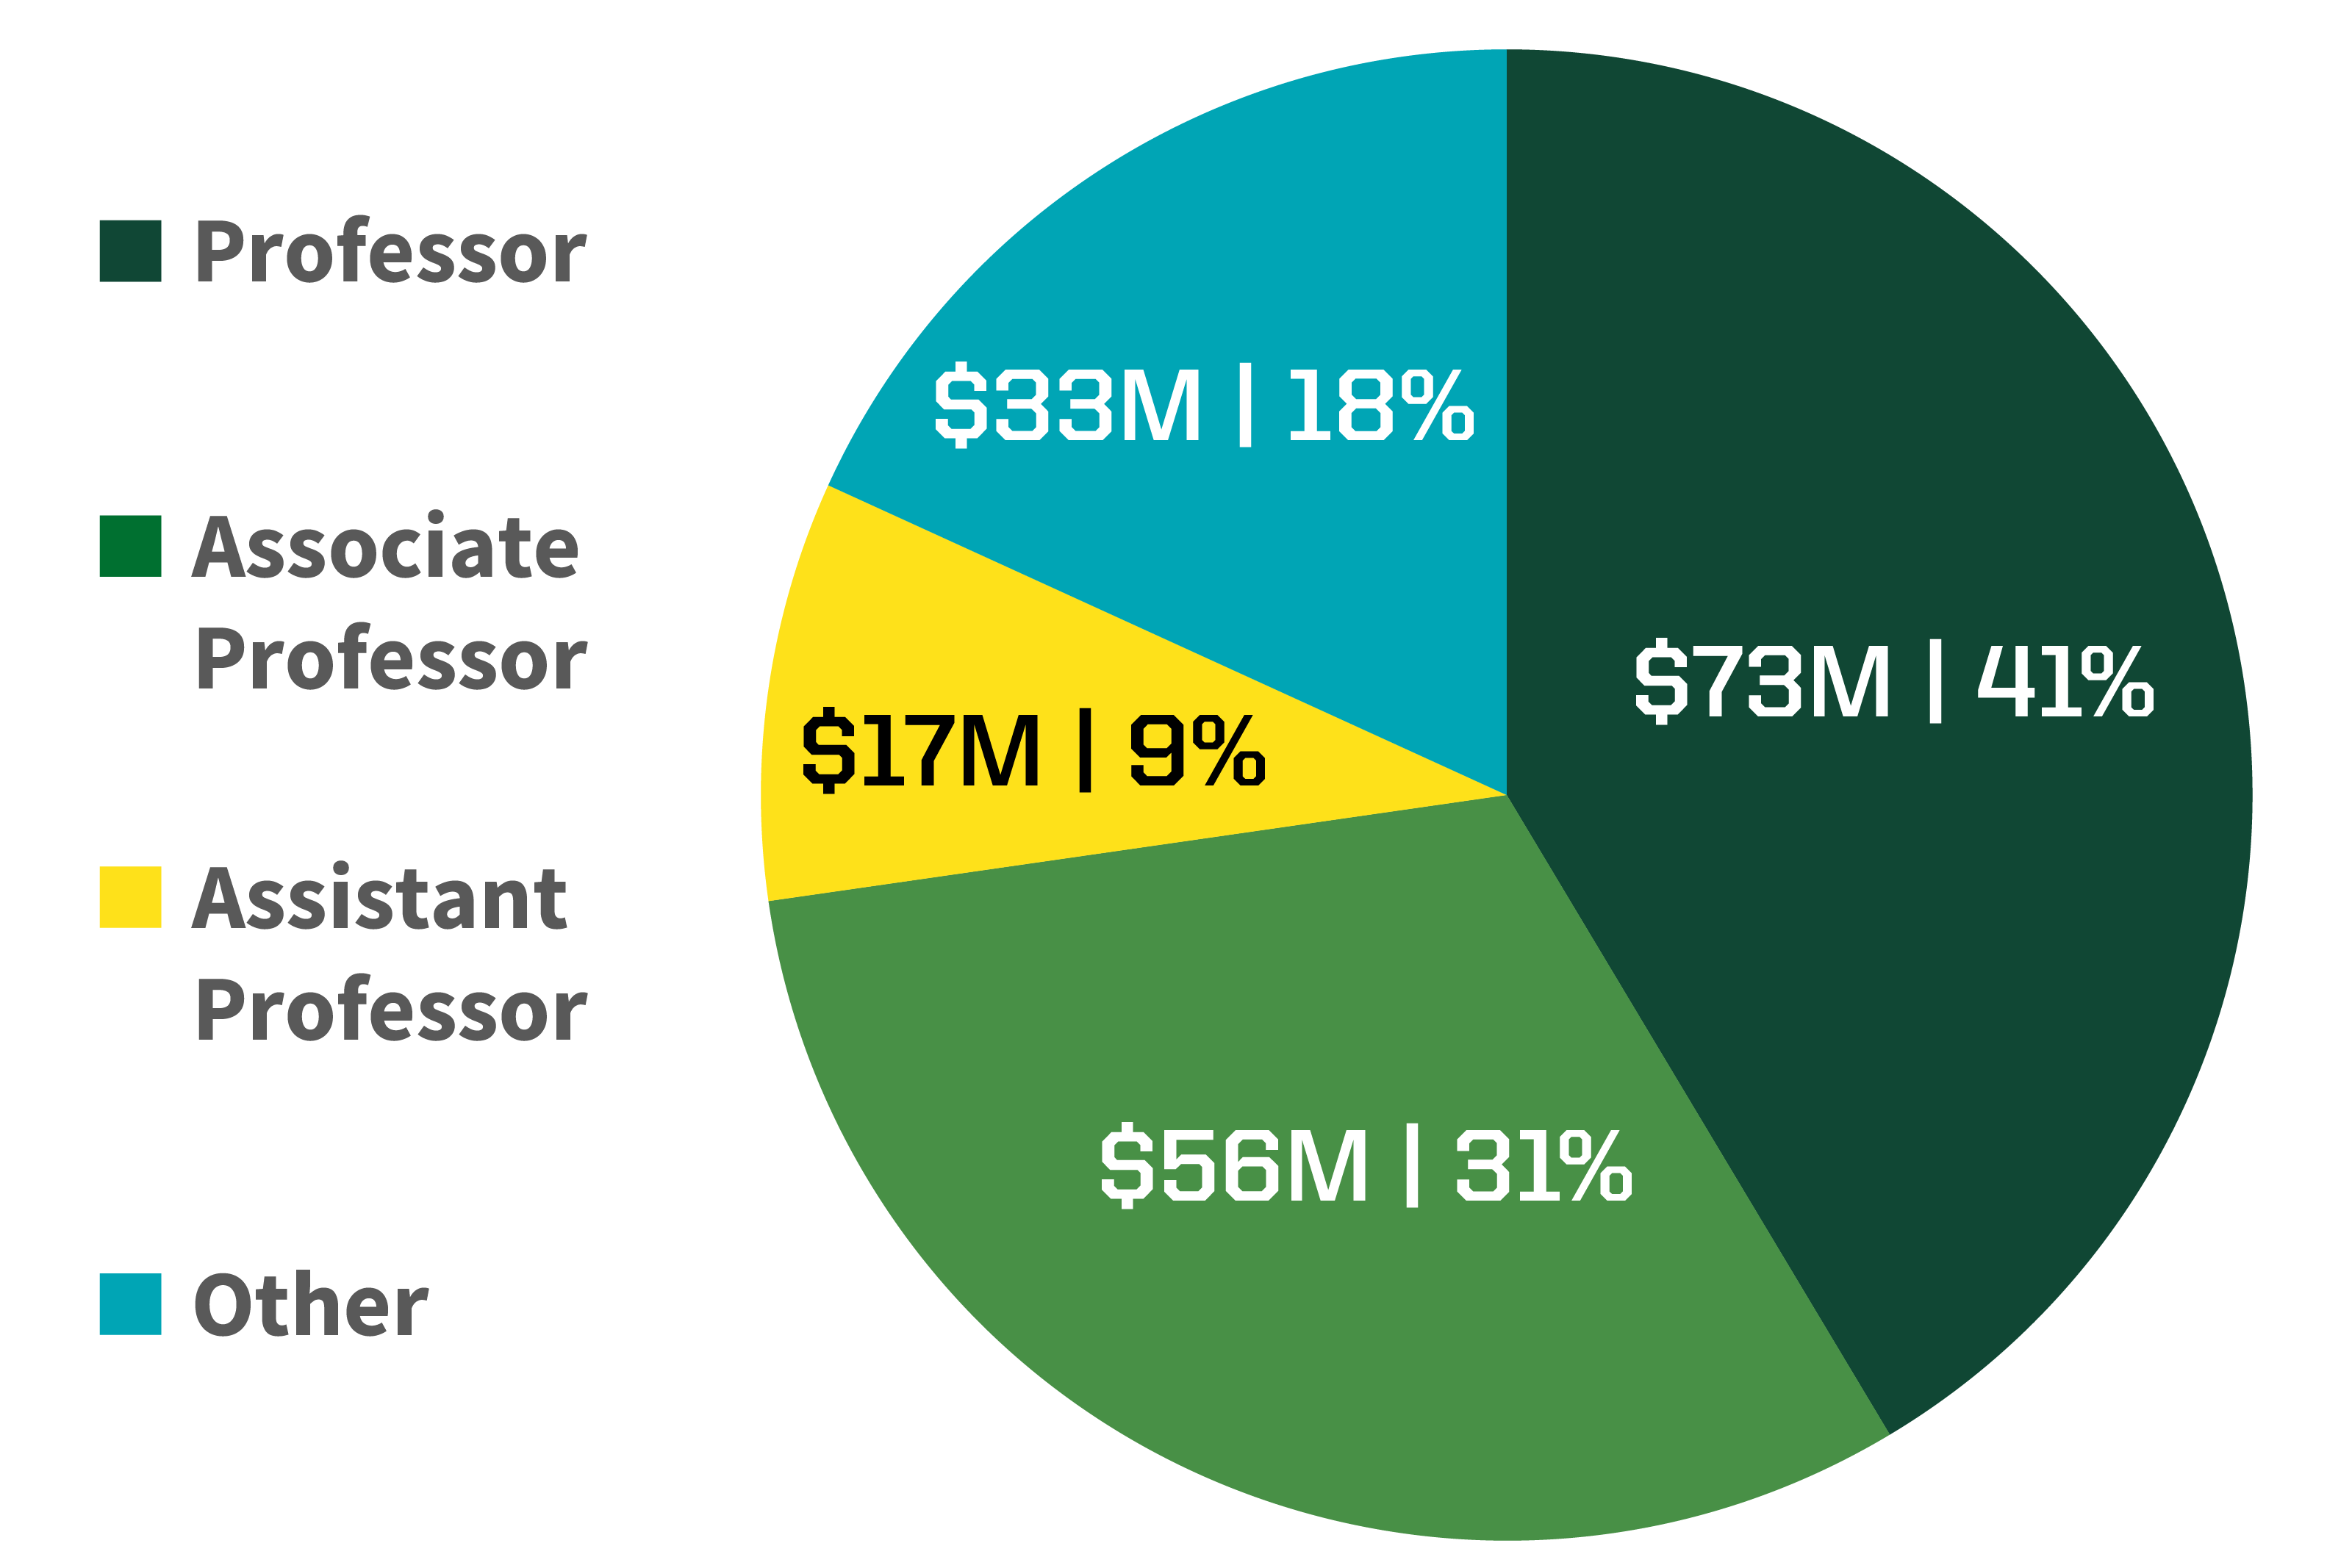
Pie chart of expenditures by faculty rank. Professor: $77M,46%. Associate Professor: $48M, 28%. Assistant Professor: $30M, 18%. Other: $14M, 8%.
Sponsored activities cover research, as well as instruction (e.g., new course or curriculum development) and service (e.g., programming and services provided by the university). In the past five years, the UO has significantly increased its new research awards, from $124M in FY20 to $178M in FY24. 
5-Year Sponsored Expenditures
 
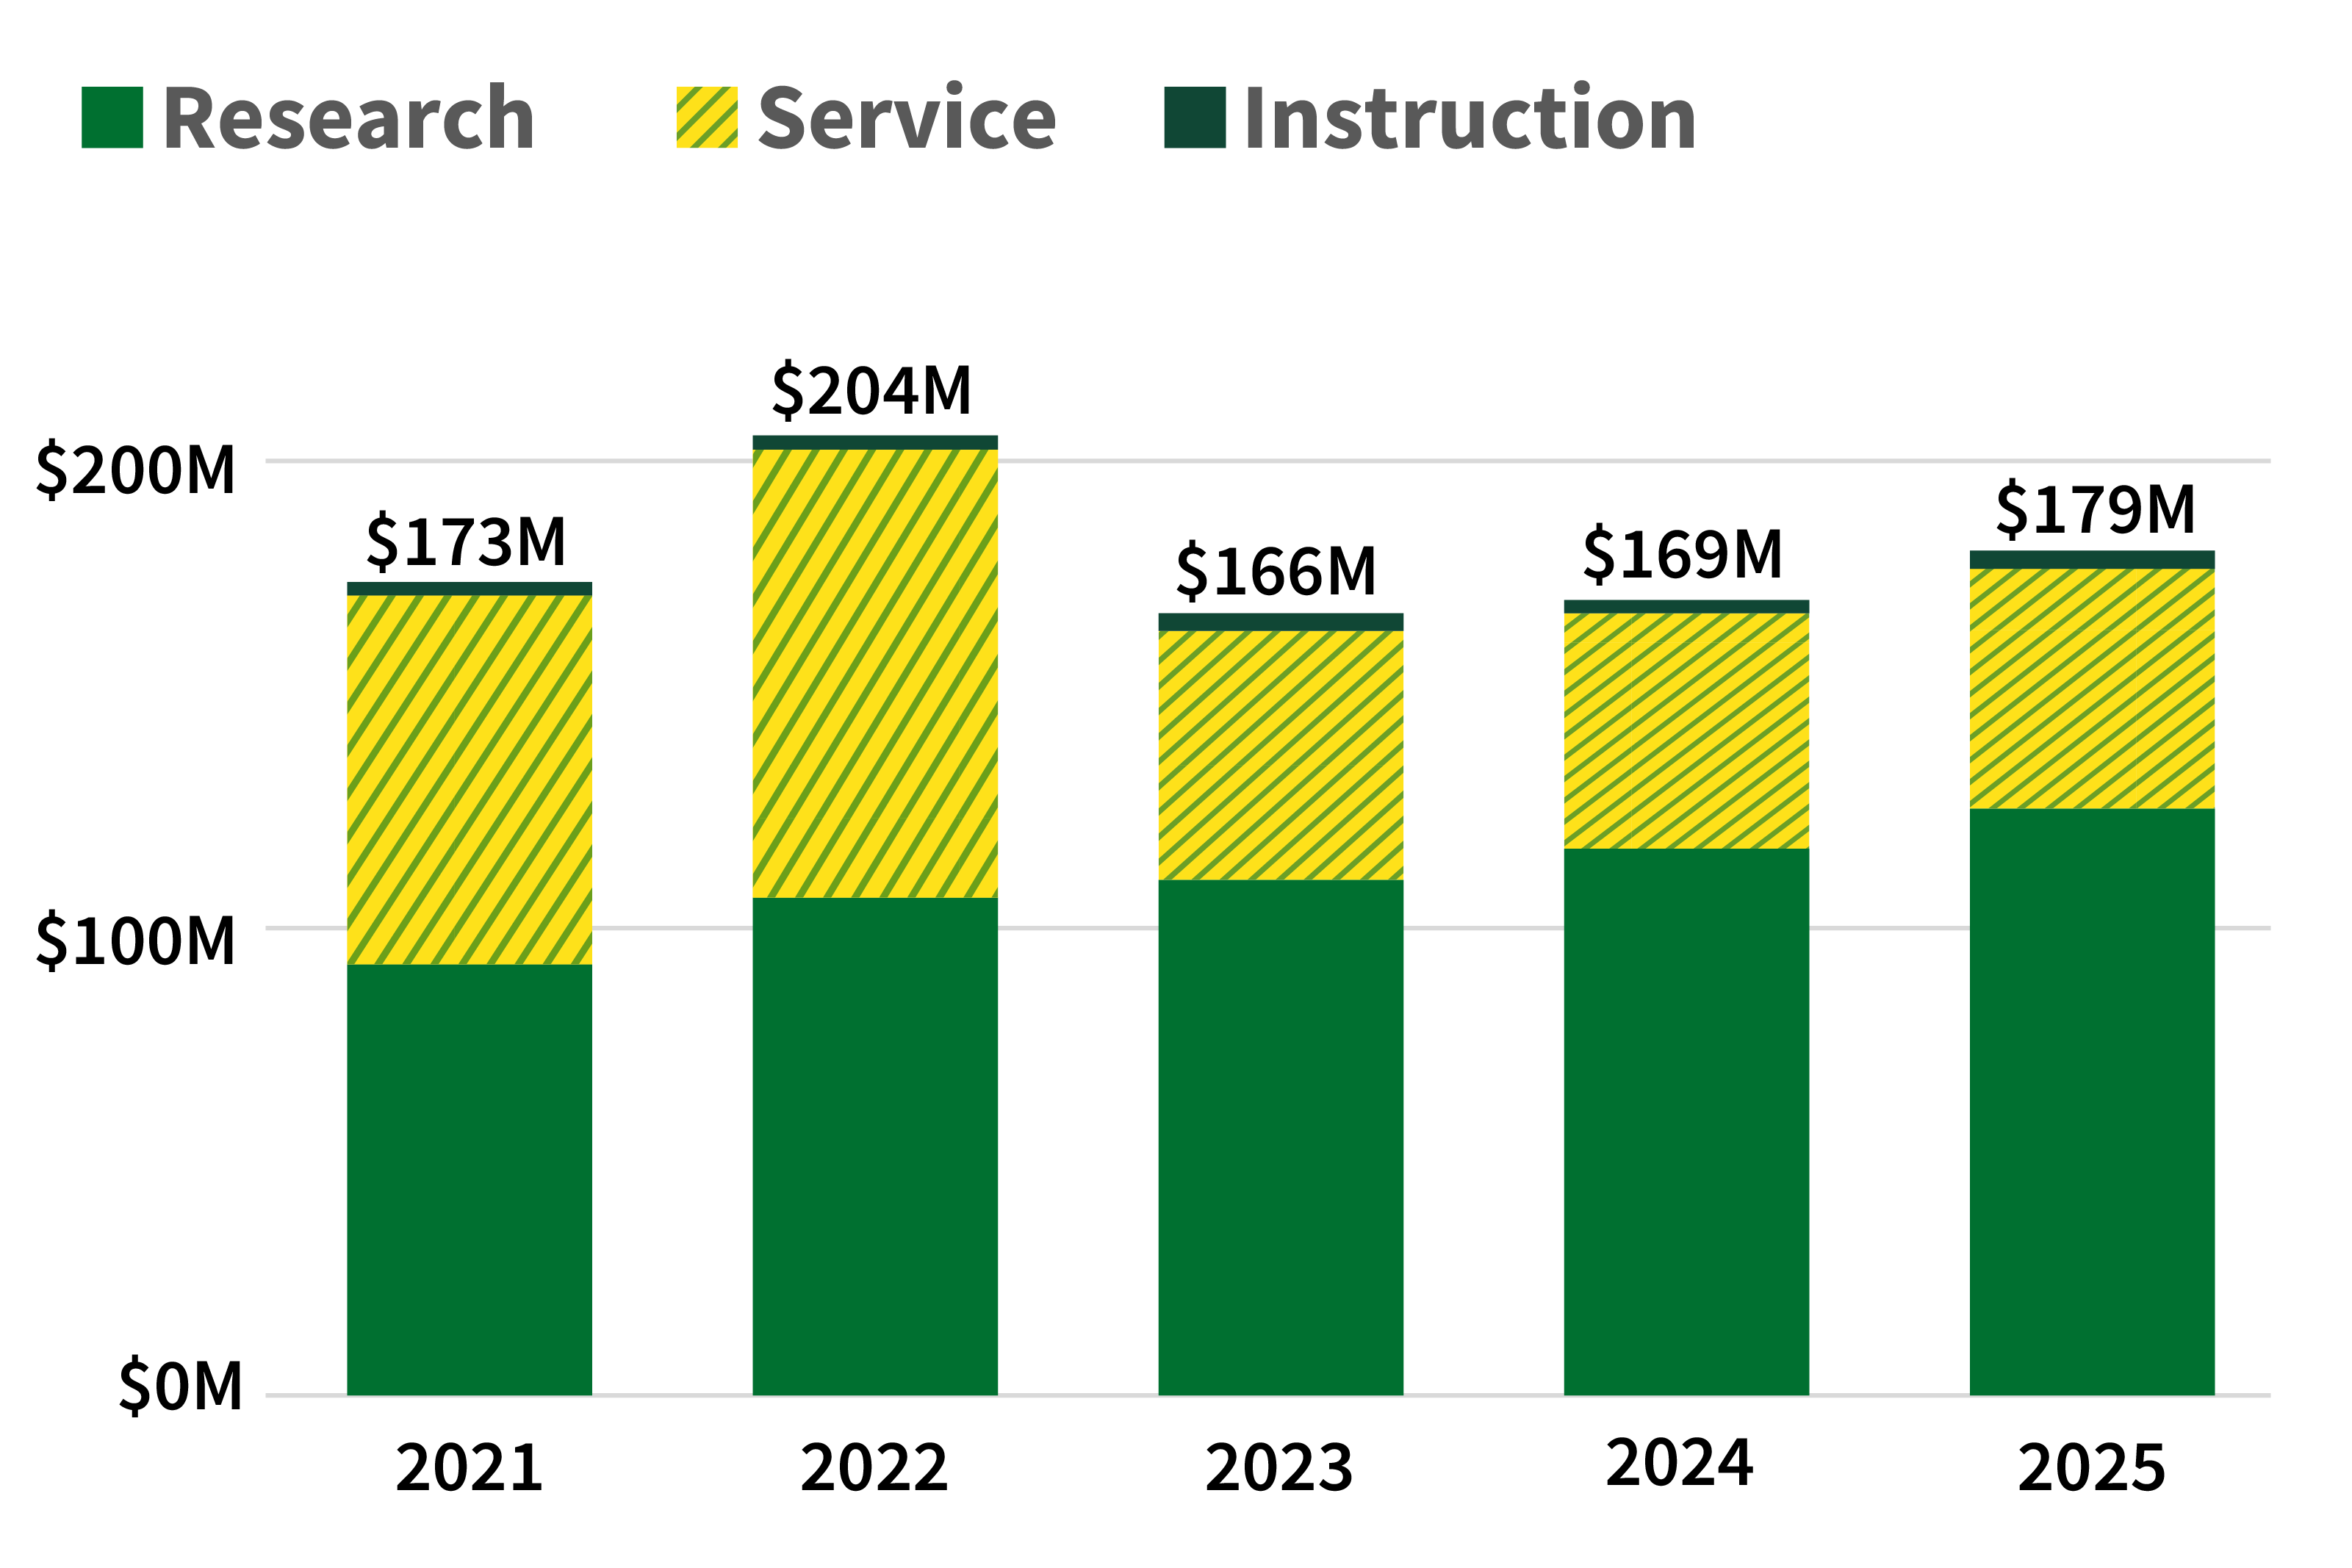
Bar chart of 5-year sponsored expenditures. In 2020, research: $87M, service: $38M, instruction: $3M, total: $128M. In 2021, research: $91M, service: $43M, instruction: $3M, total: $137M. In 2022, research: $105M, service: $45M, instruction: $3M, total: $153M. In 2023, research: $109M, service: $50M, instruction: $4M, total: $163M. In 2024, research: $116M, service: $49M, instruction: $3M, total: $169M.
Research expenditures are a critical metric for R1 universities, reflecting an institution’s ability to secure funding, drive innovation, support faculty and student research, and contribute to economic and societal advancement. Since 2020, research expenditures have grown by 28%.


More information about unit-level proposals, awards, and expenditures can be found using our Research Stats tool. A UO VPN connection is required to view this report.

The Research Stats tool will be updated soon. Please reach out to researchanalytics@uoregon.edu for more information. 
 

Celebrating our 2024 achievements.

UO drives discoveries that benefit local, regional, and global communities.


409
grants awarded


80%
federally funded


$169M
sponsored expenditures

Investors and industry partners help bring UO innovations to the world.


10,384
total licenses


29
active startups


$7.7M
licensing revenue


Reports

Monthly Awards Reports

The Office of the Vice President for Research & Innovation (OVPRI) provides a monthly summary of funding awards and projects at the University of Oregon. Please note that the monthly award reports do not include recurring task orders on existing grants., non-competitive continuations, and other types of supplemental funding.

Sponsored Project Services Annual Reporting

Sponsored Project Services (SPS), a service unit within the Office of the Vice President for Research & Innovation (OVPRI), prepares an annual summary of sponsored activity at the University of Oregon.

Financial Reporting

The Business Affairs office at the University of Oregon provides a variety of financial statements and reports, including annual and quarterly financial reports for the University. Visit their financial reports page for more information.