The University of Oregon’s research enterprise continued to grow in fiscal year 2023-24 (FY24) across all disciplines to support transformative research, scholarship, and creative activity. Sponsored project funding again increased, a key predictor of research growth with $178 million in new awards, a 47% increase from FY23.
5-Year New Award Trend
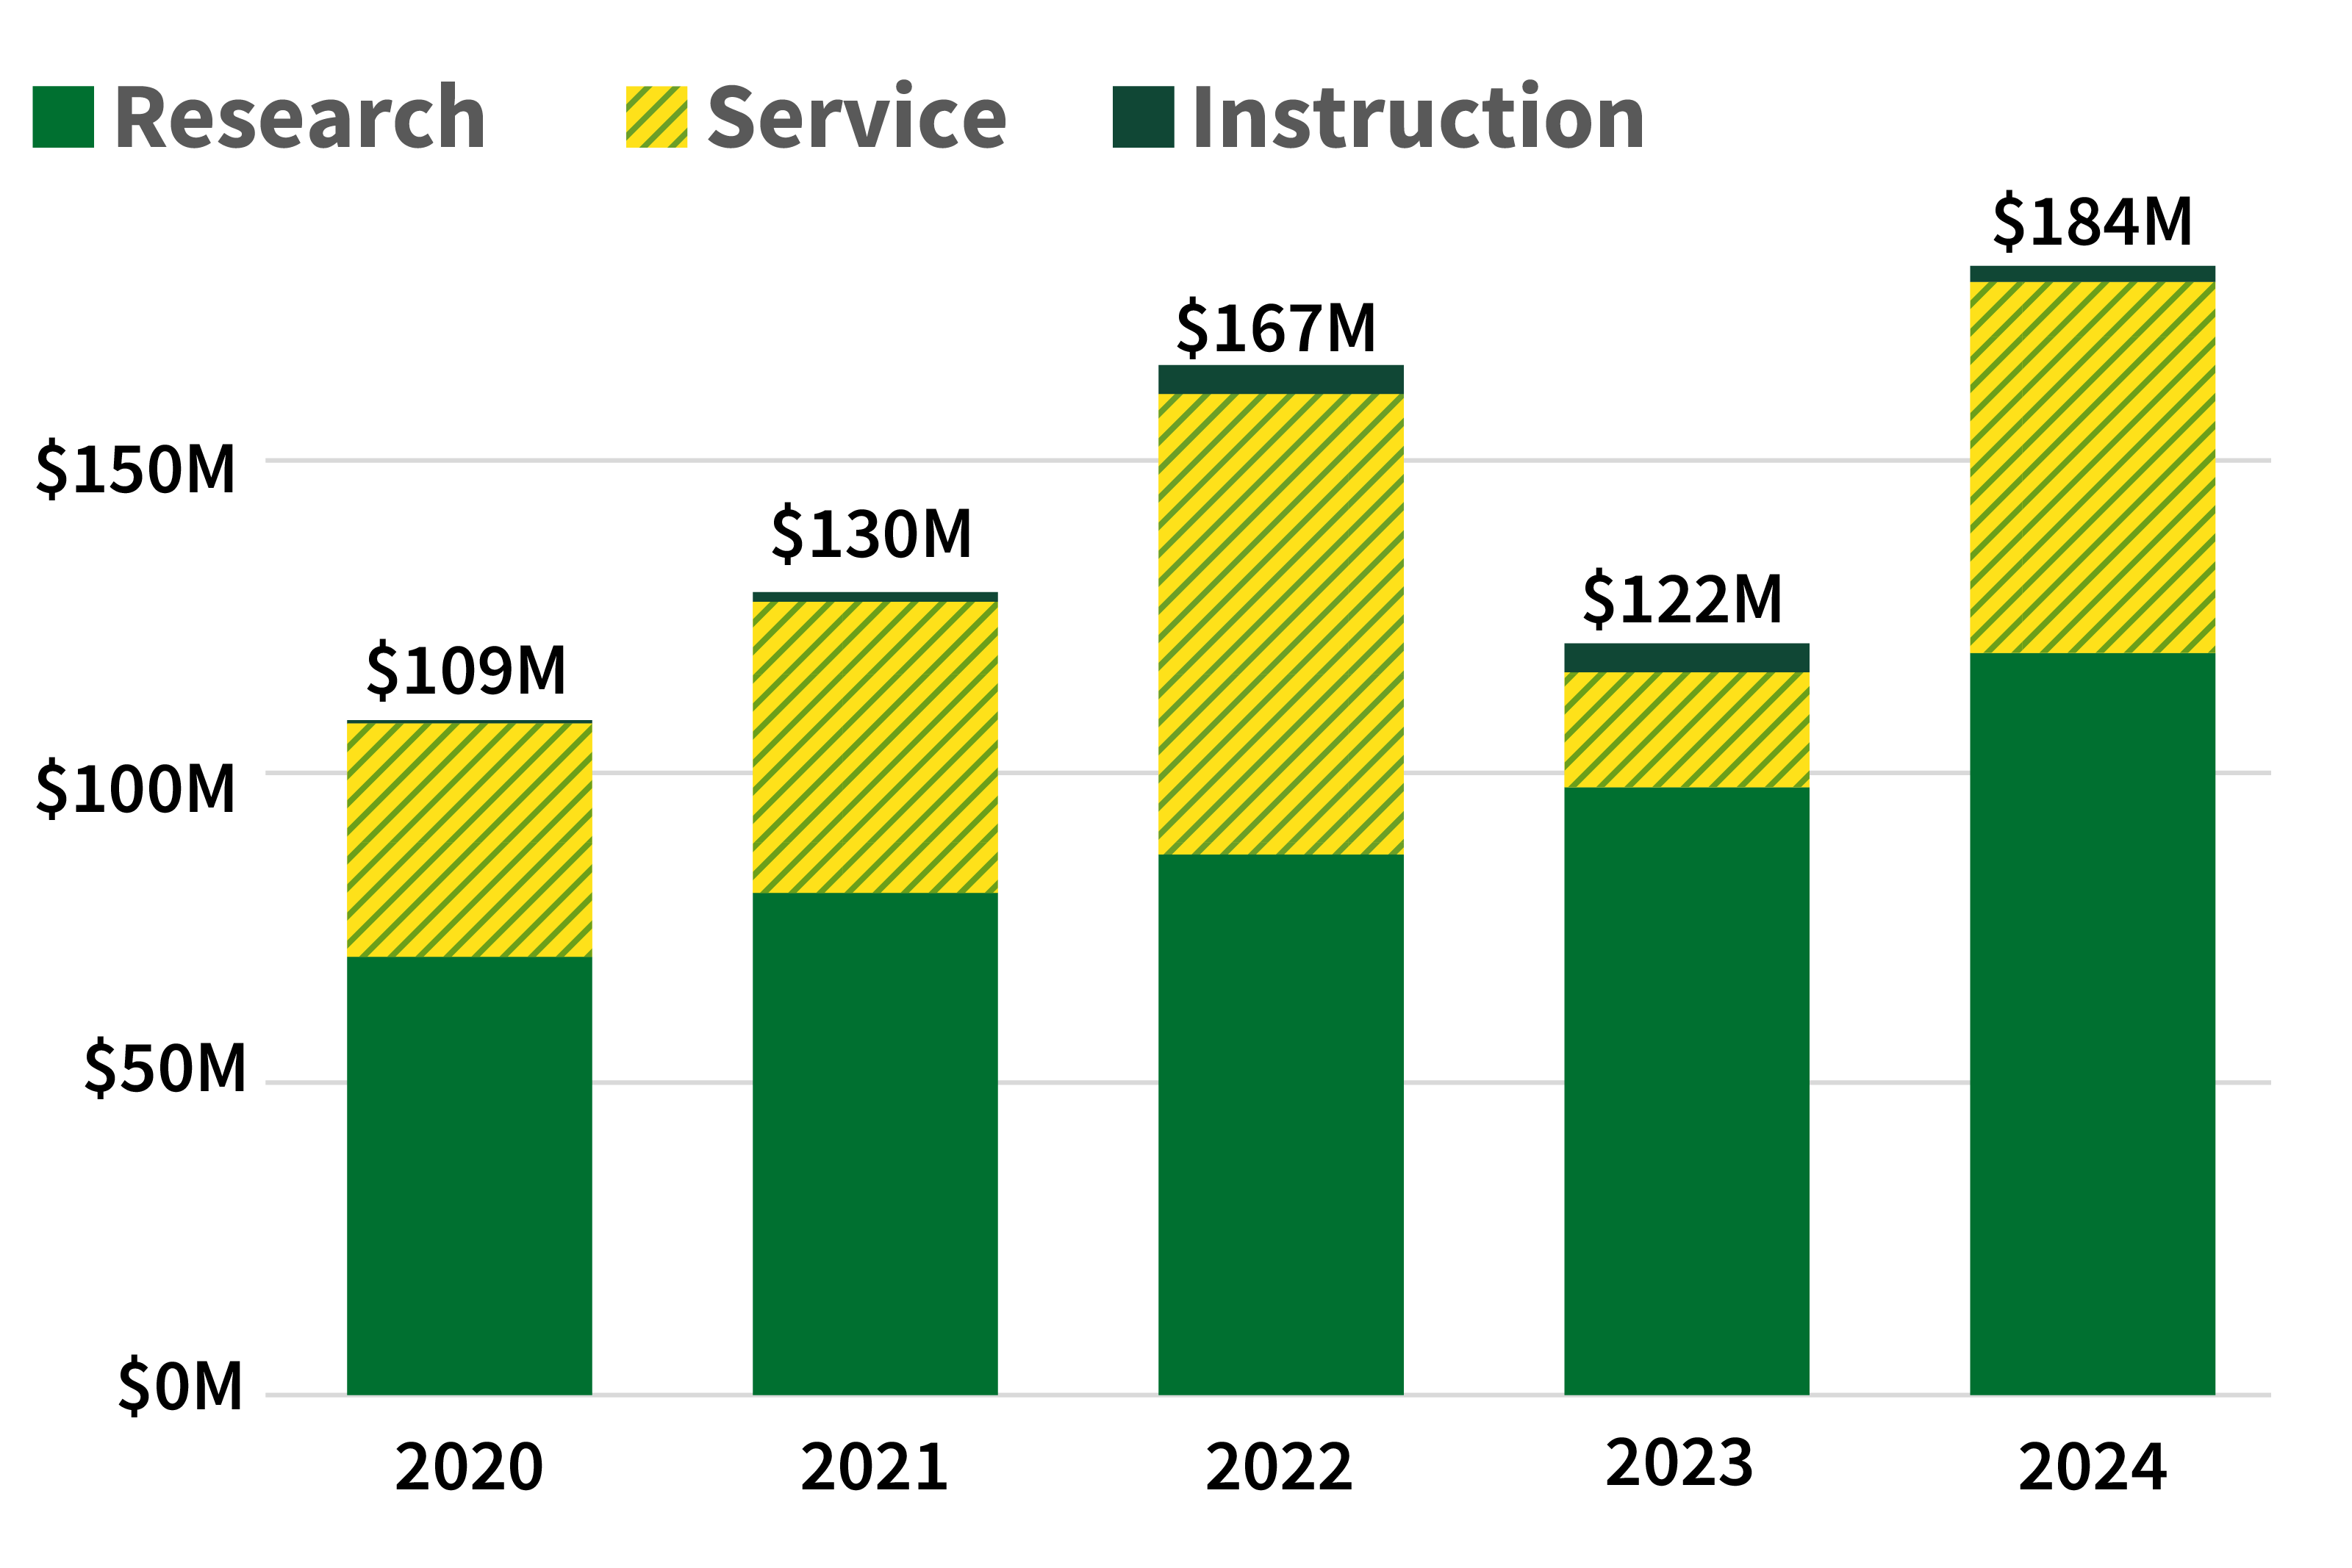
Sponsored activities cover research, as well as instruction (e.g., new course or curriculum development) and service (e.g., programming and services provided by the university). In the past five years, the UO has significantly increased its new research awards, from $124M in FY20 to $178M in FY24.
Awards by Sponsor
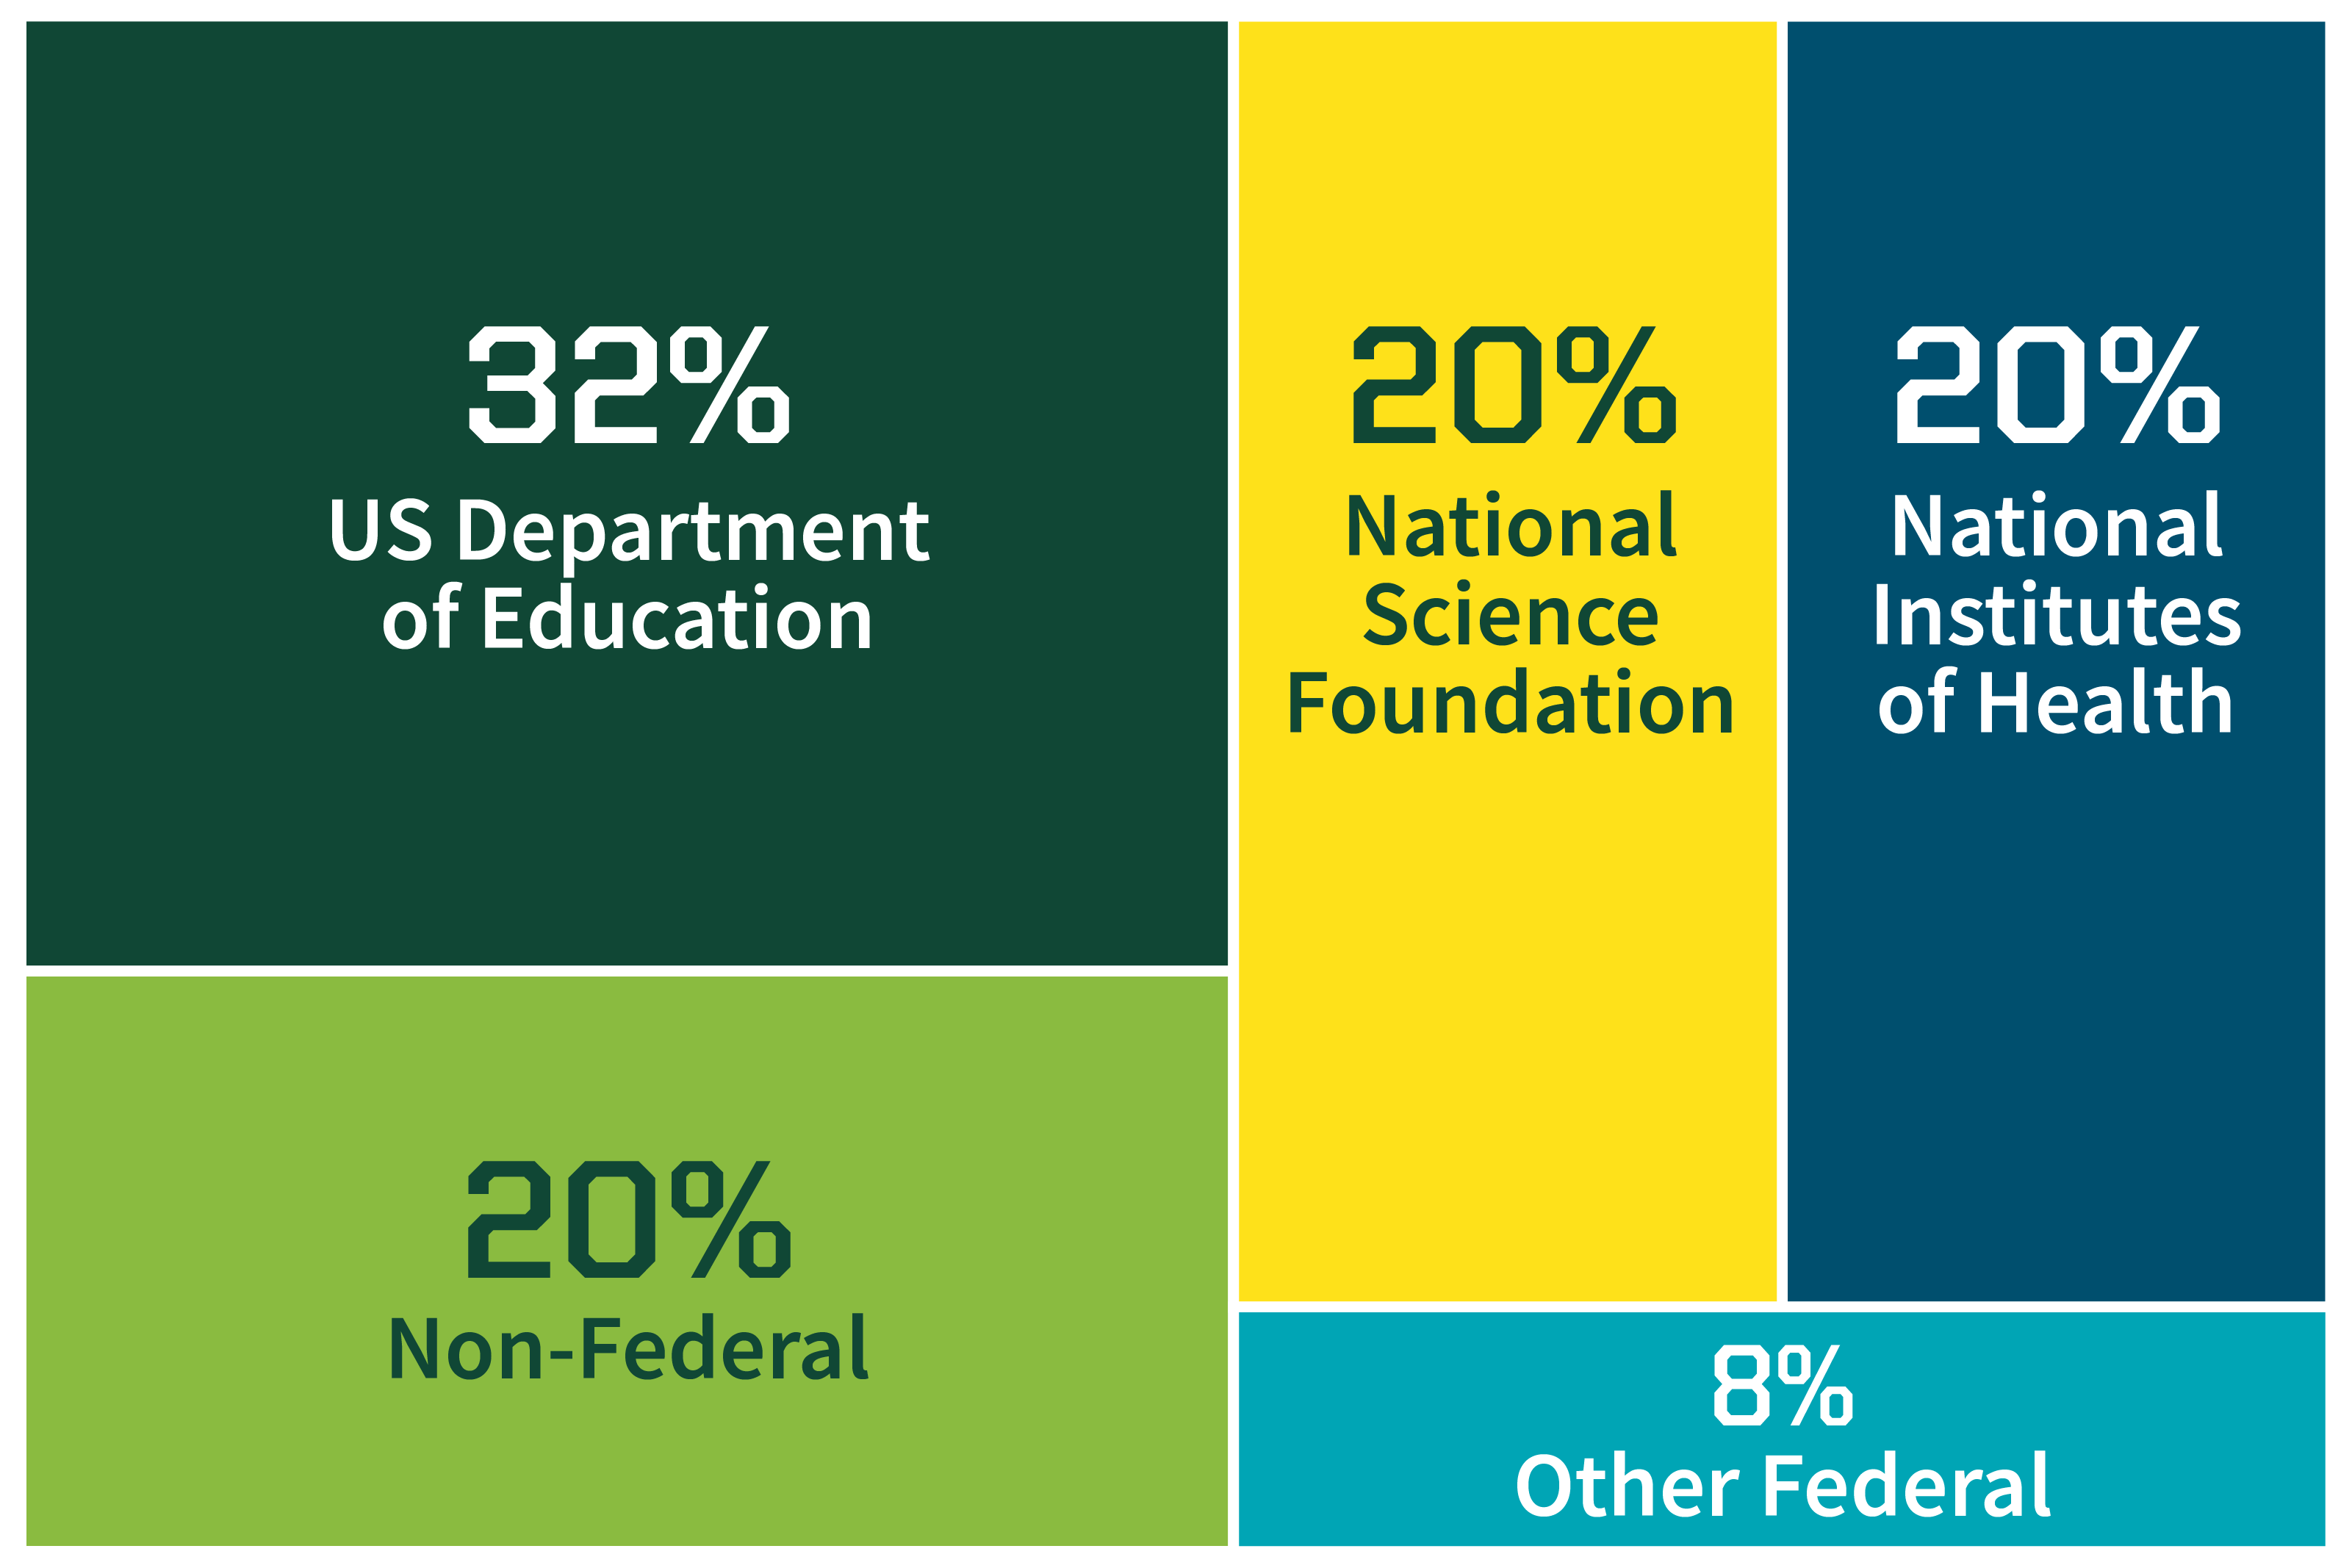
The major funders of UO sponsored activities are the US Department of Education (32%), the National Science Foundation (20%), and the National Institutes of Health (20%). Non-federal sponsors include private foundations, non-profits, state contracts, and more.
Expenditures by Faculty Rank
Sponsored activities cover research, as well as instruction (e.g., new course or curriculum development) and service (e.g., programming and services provided by the university). In the past five years, the UO has significantly increased its new research awards, from $124M in FY20 to $178M in FY24.
5-Year Sponsored Expenditures
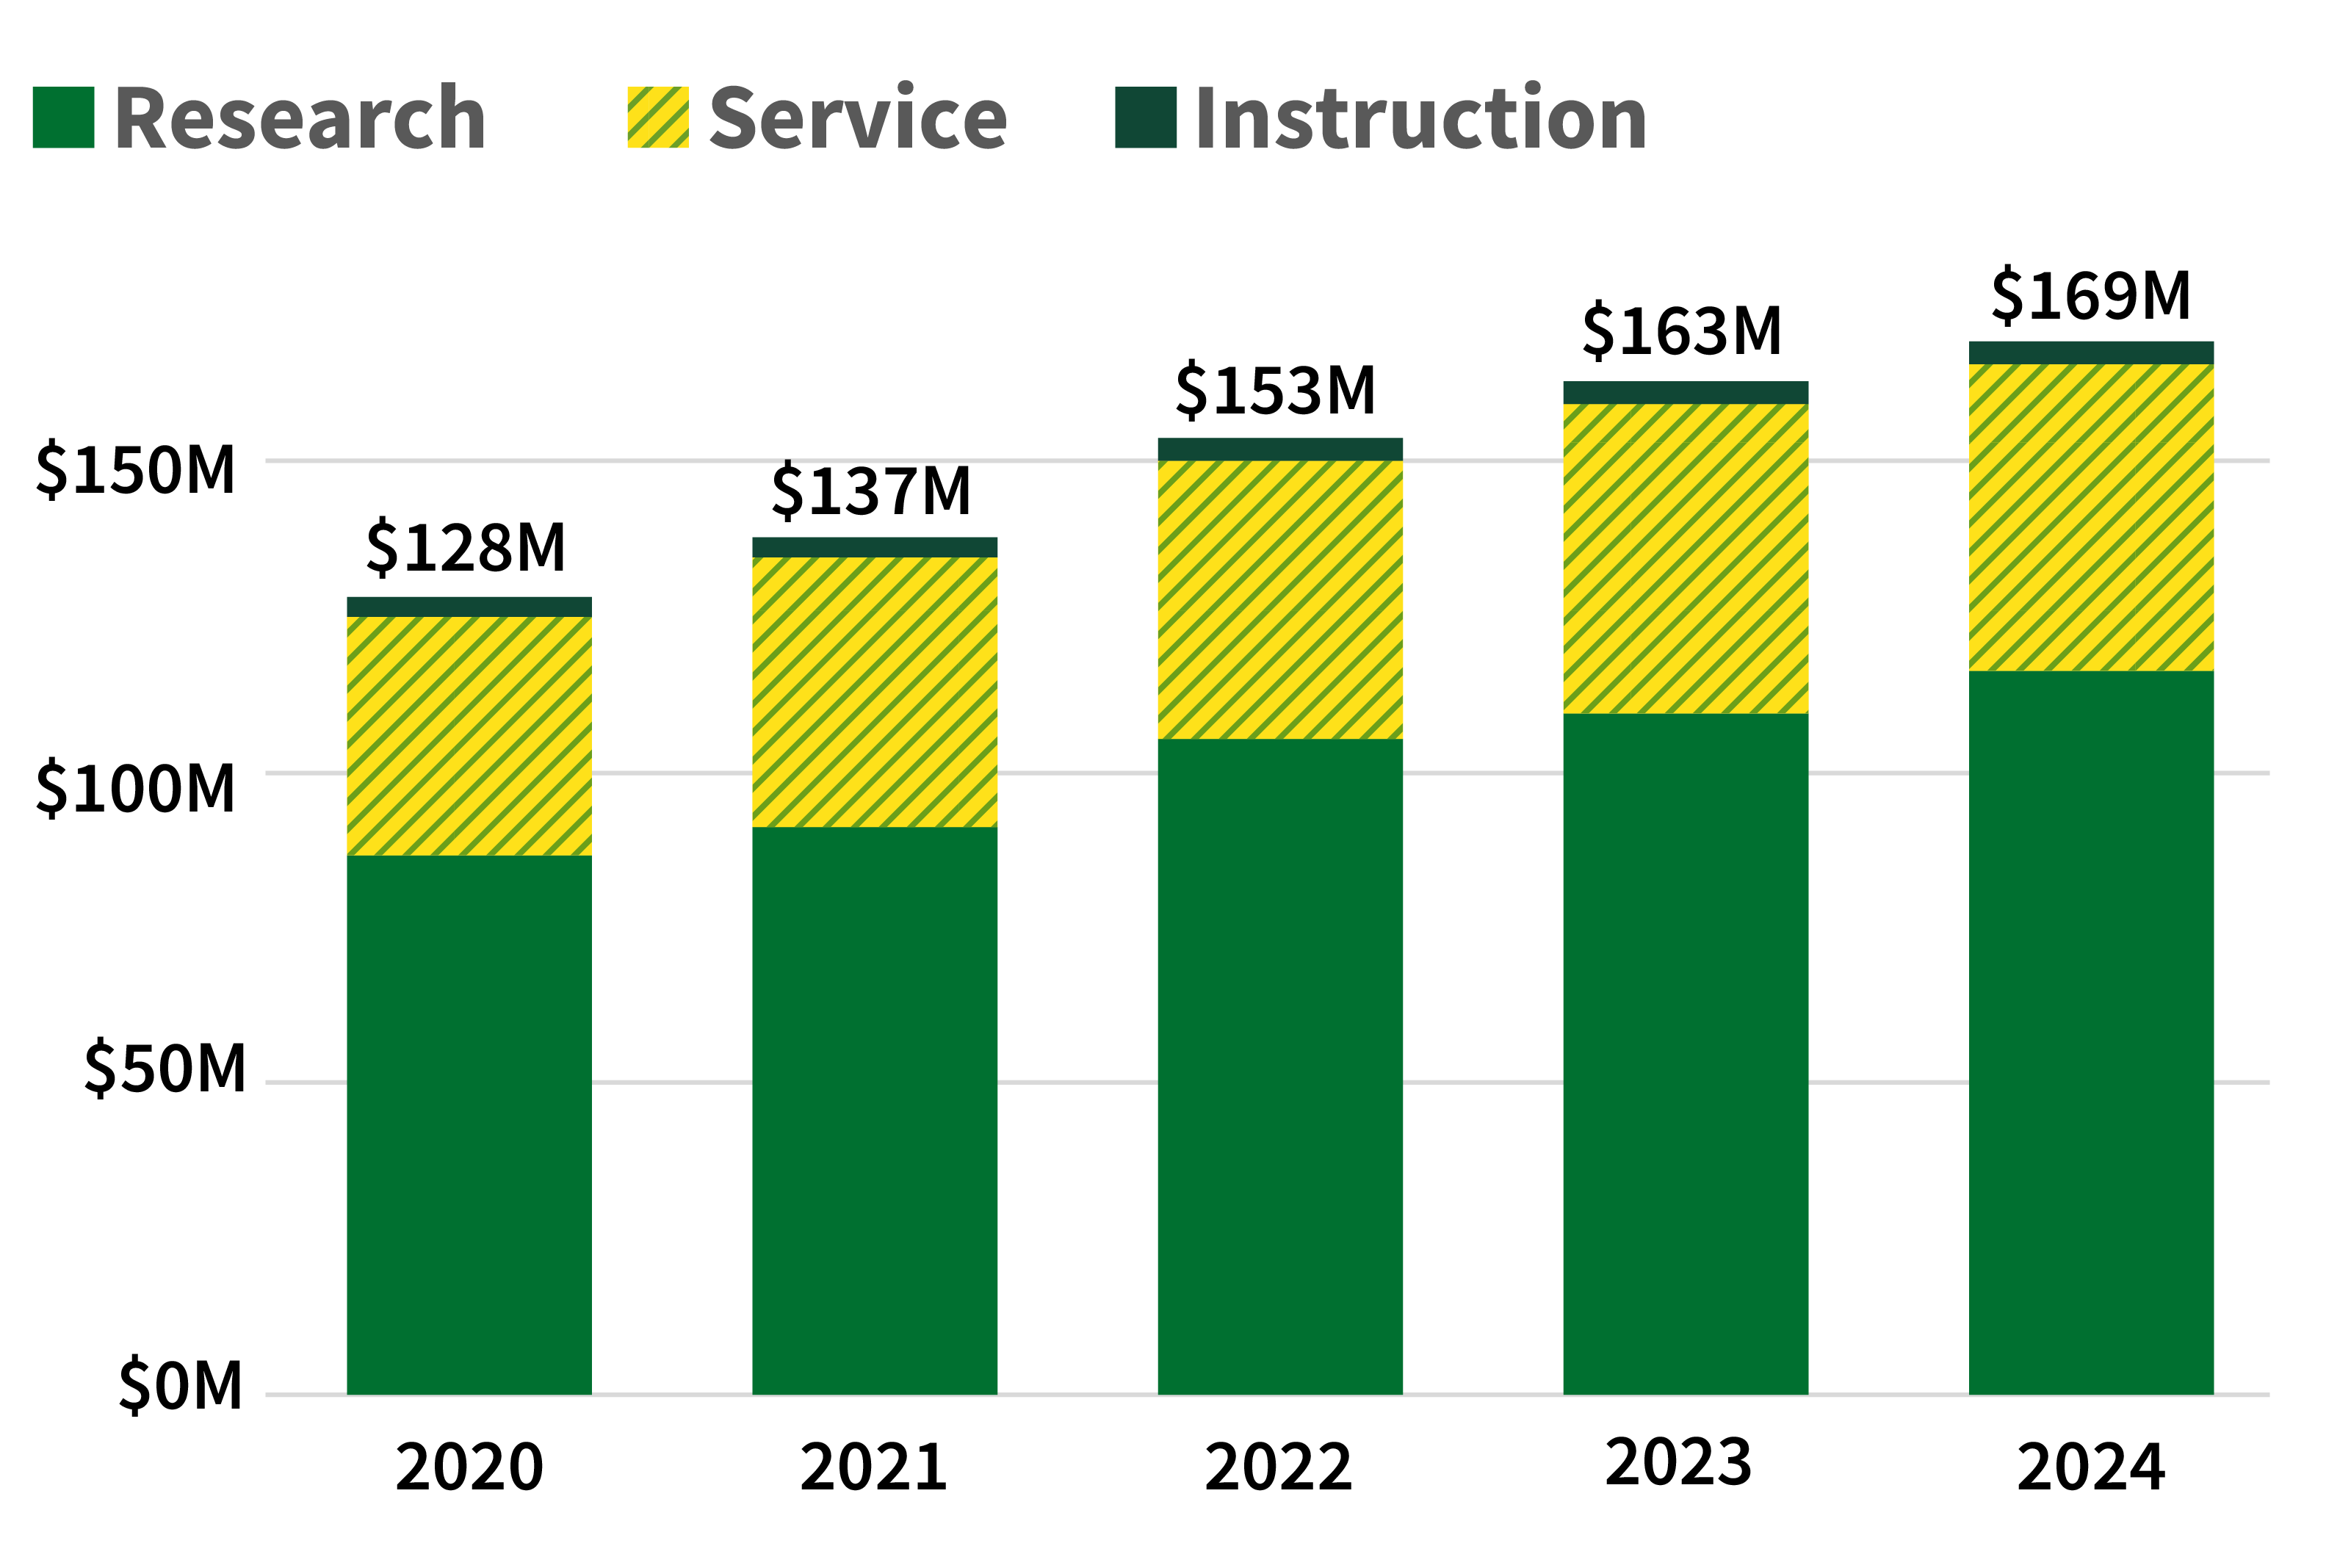
Research expenditures are a critical metric for R1 universities, reflecting an institution’s ability to secure funding, drive innovation, support faculty and student research, and contribute to economic and societal advancement. Since 2020, research expenditures have grown by 28%.
FY24 Research Impact Statistics
Research expenditures increased to $7 million over FY23 to $116 million.
$178 million
external funding
$7 million
increase in research expenditures from the previous year
409 grants
awarded to investigators
- The University of Oregon (UO) was awarded $178 million in grants, contracts and competitive awards in FY 24.
- The total comprised 409 awards.
- Federal award support made up 91% of the total funding awarded in FY 24.
- 1,082 proposals were submitted requesting $721.1 million in total funding.
- Total expenditures in FY 24 totaled $169 million, an increase of 1.7% from the previous year.
- Research expenditures in FY 24 totaled $116 million, an increase of $7 million over the previous year.
Innovation Impact Statistics
UO is a key contributor in the state's high innovation ranking: Oregon is #3 in the U.S. for innovation economy and business competitiveness.
$7.7 million
licensing revenue
10,384
total copyright, trademark, and patent licenses
29
total active startups with ties to the UO